在Vue项目中封装echarts

文章目的:在vue项目中使用echarts针对相同类型的数据渲染,无法定位渲染id和繁琐问题
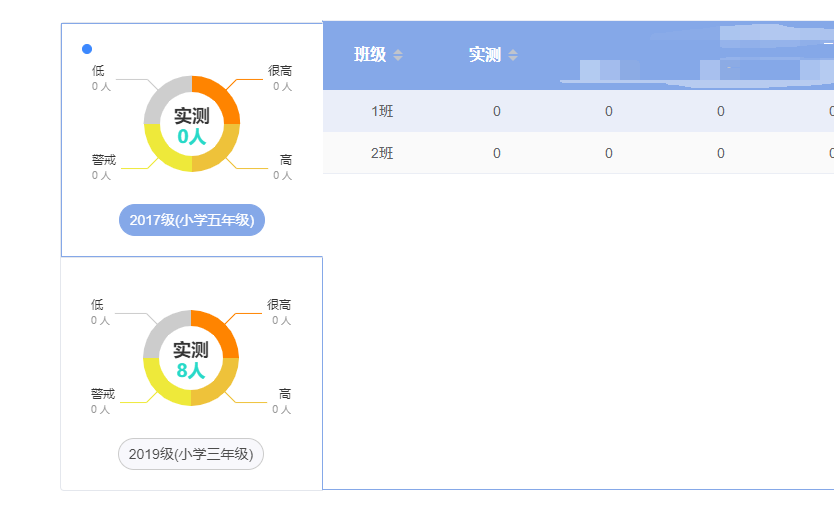
先看效果图

image-20210814185111072

下载依赖

1
npm install echarts

在main.js中引入依赖

1
2
// 引入echarts
import * as echarts from 'echarts';

在公共的方法文件夹中创建echarts.js文件

代码如下:

1
2
3
4
5
6
7
8
9
10
11
12
13
14
15
16
17
18
19
20
21
22
23
24
25
26
27
28
29
30
31
32
33
34
35
36
37
38
39
40
41
42
43
44
45
46
47
48
49
50
51
52
53
54
55
56
57
58
59
60
61
62
63
64
65
66
67
68
69
70
71
72
73
74
75
76
77
78
79
80
81
82
// @/util/echarts.js
export default class {
// echarts, id, seriesdata,answerTotal都是vue组件中传递过来的参数
constructor(echarts, id, seriesdata, answerTotal) {
console.log(seriesdata) //echarts, id, seriesdata,answerTotal都是vue组件中传递过来的参数
this.echarts = echarts;
let option = this.getOption(seriesdata, answerTotal) //把参数传递给方法
var myChart = this.echarts.init(document.getElementById(id)); //获取dom
myChart.setOption(option); //暴露出去

}

getOption(seriesdata, answerTotal) {
let option = {
// 环形中间的标题
title: {
text: answerTotal + "人",
left: "center",
top: "50%",
textStyle: {
color: "#27D9C8",
fontSize: 18,
align: "center"
}
},
// 环形中间的标题
graphic: {
type: "text",
left: "center",
top: "40%",
style: {
text: "实测",
textAlign: "center",
fill: "#333",
fontSize: 18,
fontWeight: 700
}
},
legend: {
show: false, //图例显示与隐藏
},
series: [
{
type: 'pie',
// roseType: 'area',
radius: ['40%', '60%'],
center: ['50%', '50%'],

label: {
alignTo: 'edge',
formatter: '{name|{b}}\n{time|{c} 人}',
minMargin: 5,
edgeDistance: 10,
lineHeight: 15,
rich: {
time: {
fontSize: 10,
color: '#999'
}
}
},
itemStyle: {
normal: {
color: function (colors) {
var colorList = ['#FF8400', '#EEC23A', '#EEE93A', '#CCCCCC'];
return colorList[colors.dataIndex]
}
},
shadowBlur: 200,
shadowColor: 'rgba(0, 0, 0, 0.5)'
},
data: seriesdata,

}
]

};

return option;
}
}

在Vue所需echarts文件中引入该echarts.js文件

1
2
// 引入封装的echarts方法
import echarts from "@/util/echarts.js"

规划好echarts放置的地方

1
2
3
<div class="hello">
<div id="main" style="width: 600px; height: 400px"></div> //echarts存放的div
</div>

实例化一个渲染echarts的方法

1
2
3
4
5
6
methods: {
addEcharts() {
new echarts(this.$echarts, "main", this.seriesdata,this.answerTotal);
//echarts传参,this.$echarts声明是echarts,main是div的ID, this.seriesdata,this.answerTotal是传递参数
},
},

在Vue生命周期mounted阶段调用该方法

1
2
3
mounted() {
this.addEcharts(); //调用组件的时候自动调用这个方法
},

效果如下:

image-20210814185044874

可能遇到的问题(待补充)

echarts.js?5fd2:7 Uncaught (in promise) TypeError: Cannot read property ‘init’ of undefined
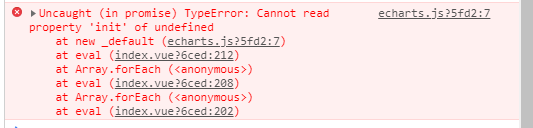
image-20210814184516054

原因:

对于数据加载和dom初始化过程,如果不加限制 使用echarts 绘图的js方法有很大机率先于dom初始完成之前运行,所以造成图表不显示。

解决办法:

使用setTimeout函数延迟运行绘图的js.时间在500毫秒左右,可根据情况调整;

1
2
3
4
5
6
7
8
9
10
11
12
13
14
15
16
17
18
19
20
21
22
23
24
25
26
27
28
29
30
31
32
33
34
35
36
37
38
// @/util/echarts.js
export default class {
// echarts, id, seriesdata,answerTotal都是vue组件中传递过来的参数
constructor(echarts, id, seriesdata, answerTotal) {
console.log(seriesdata) //echarts, id, seriesdata,answerTotal都是vue组件中传递过来的参数
this.echarts = echarts;
let option = this.getOption(seriesdata, answerTotal) //把参数传递给方法


// 修改的地方👇👇👇
setTimeout(function () {
var myChart = this.echarts.init(document.getElementById(id)); //获取dom
myChart.setOption(option); //暴露出去
}, 500)
// 修改的地方👆👆👆


}

getOption(seriesdata, answerTotal) {
let option = {
...
...
...(中间均未发生改变)
...
...
},
data: seriesdata,

}
]

};

return option;
}
}